Are you still waiting on end-of-year recaps 6 weeks after the season ended?
Through our work with brands, rights holders, and agencies, we noticed a theme, partnership recaps take FOREVER – forever to produce and forever to receive. Then, once you finally do receive it – usually 4 to 8 weeks later – it’s a fluffy PDF or PowerPoint. It’s fluffy because tracking down all the data needed to provide a thorough analysis is time consuming and tying results back to actual partnership objectives is a manual process.
You need more evaluation and insights and less fluff, though. You need to know how a partnership performed against the objectives set, how partnerships compare, and if your entire portfolio is performing well. Most important of all, you need to know if your partnership investments are contributing toward business goals.
Understanding the market’s needs, we developed a tool in our Evaluate product that allows every partner to submit essential performance data at any time. The timely collection of data that matters most to your organization reduces the wait time for recaps. It also feeds into reports that give you insights to how underlying metrics performed in striving to meet objectives. With better reporting and insights throughout the season, you can make impactful performance-based investment decisions.
The Data Submission Portal Unifies Performance Data
The new Data Submission portal tool in Evaluate lets your data providers (e.g., partners and agencies) submit files through a customized web-based portal. The customized portal is a secure way for data providers to submit the performance data needed to evaluate your partnerships. The portal also establishes a system for data providers to submit quantitative and qualitative metrics as soon as they’re available.

To start, a data provider logs into your Data Submission Portal and selects an account. Once they select an account, the submitter is given a list of form options based on the type of data they are submitting. Based on the form selected, the submitter downloads the corresponding .CSV template, which includes instructions to complete the form structure for submission.
Then, the submitter populates the .CSV template and uploads it back into the portal for ingestion. The .CSV template takes the data and standardizes it into a format that aligns with your data warehouse. After it’s uploaded, you, the data recipient, can review or decline the data before it’s appended to your data warehouse and visualized via Tableau dashboards for near-time insight into how that partnership’s objectives are tracking.
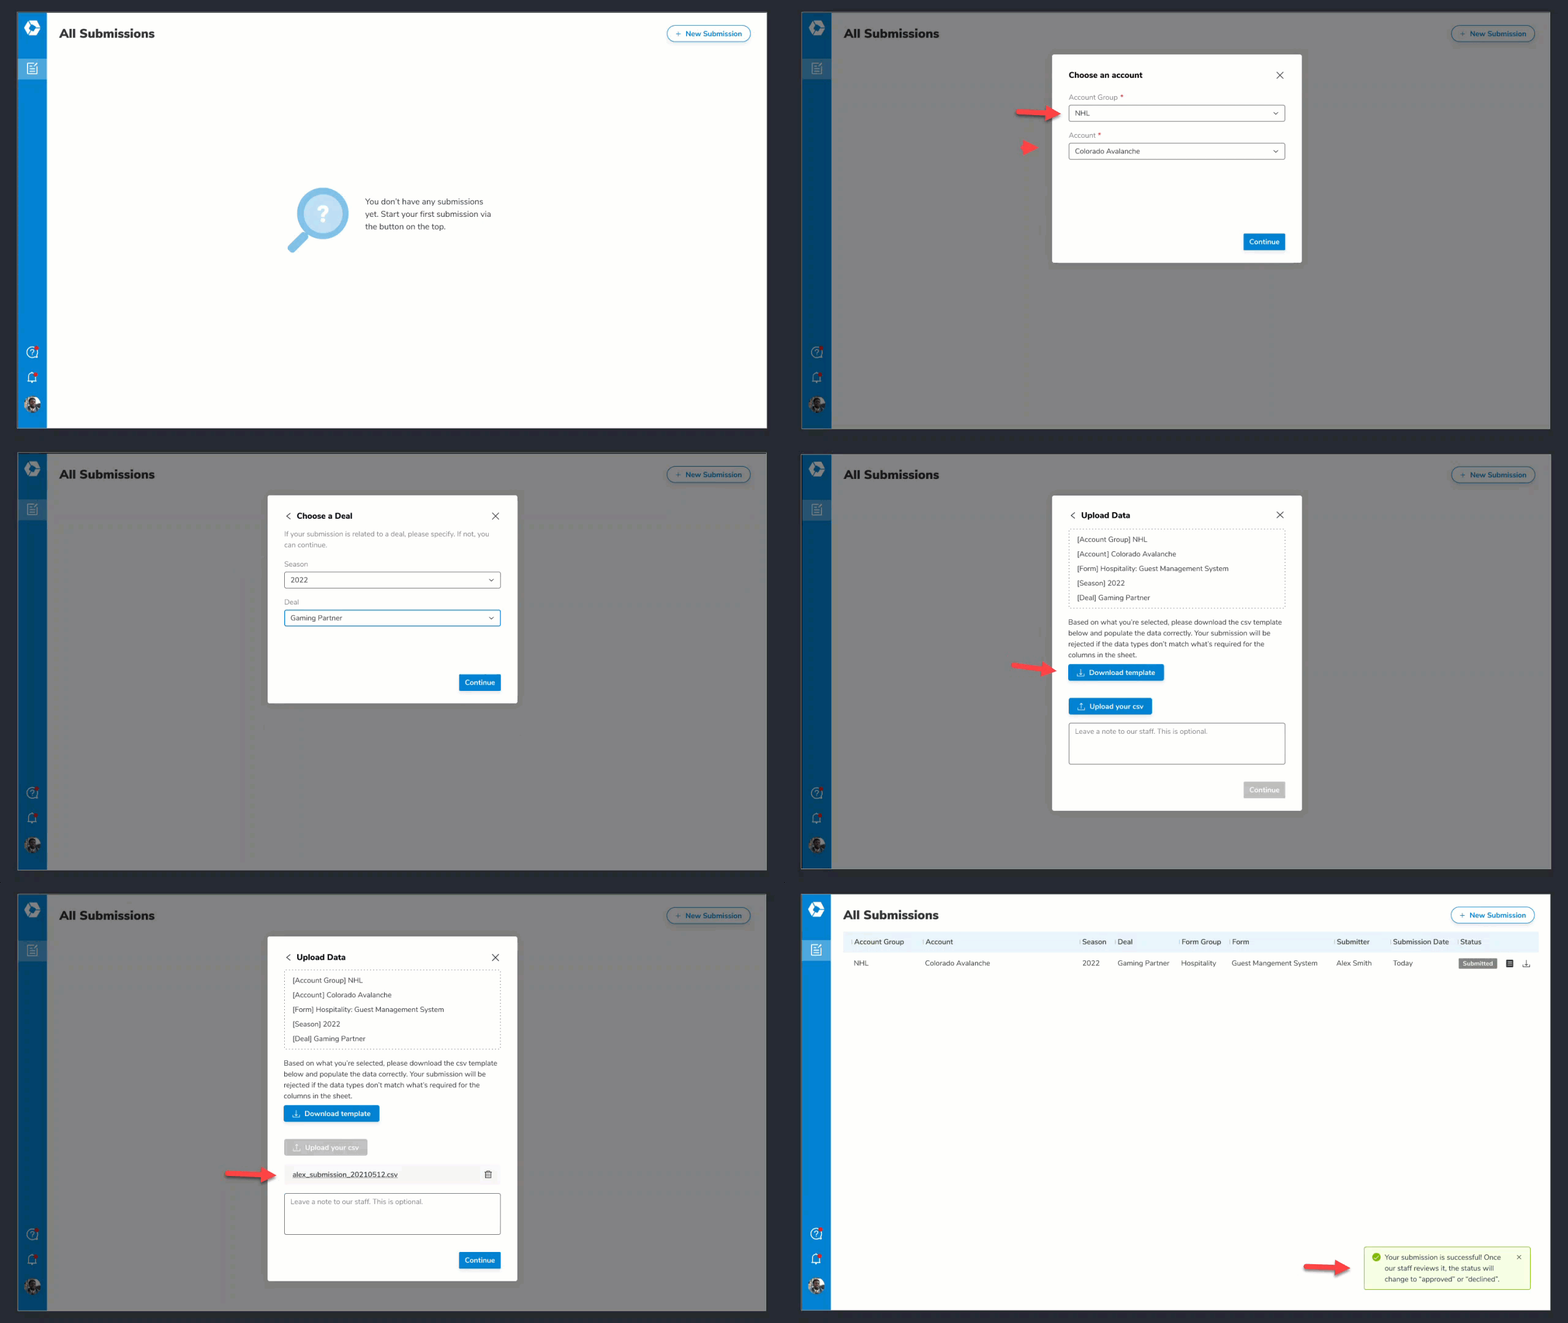
In the example above, a data provider logs into the brand’s portal to upload the latest hospitality event metrics for a specific account using the Hospitality: Guest Management System form. Once the submitted data is approved by the reviewer (e.g., the brand), it’s visualized via Tableau dashboards for near-time insight into how hospitality metrics are tracking for this specific account.
What our customers love about the Data Submission Portal include:
- Customizable portal to match your brand’s look and feel
- Unique forms based on your business objectives (e.g., hospitality, customer acquisition, social media, media valuation)
- Data validation upon upload so accurate metrics are always submitted
- Reduced waiting time on data availability
- Data-focused results and reduction in recap noise
Performance-led Decisions & Optimized Partnerships with Near-Time Insights
The Data Submission Portal makes data centralization quicker by unifying it directly from data providers and integrations. Plus, you can breathe easy knowing all data submissions are subject to KORE’s rigorous QC and data validation process.
Uploading partnership metrics any time via the portal also increases the availability and frequency of reporting so you don’t have to wait weeks for insights. Dashboards are updated in near time when new information is added, providing up-to-date results and benchmarking. You can also provide Tableau dashboard access to individual partners so you both track deal progress and collaborate on optimizing your partnership. For example, if you notice a partner is going to fall short reaching their impressions objective you can quickly reach out to activate or pivot in real time. Without this visibility, you wouldn’t have known this social objective was falling behind and couldn’t work to correct it until it was too late.
Partnership Overview Dashboard Showing Impressions per Week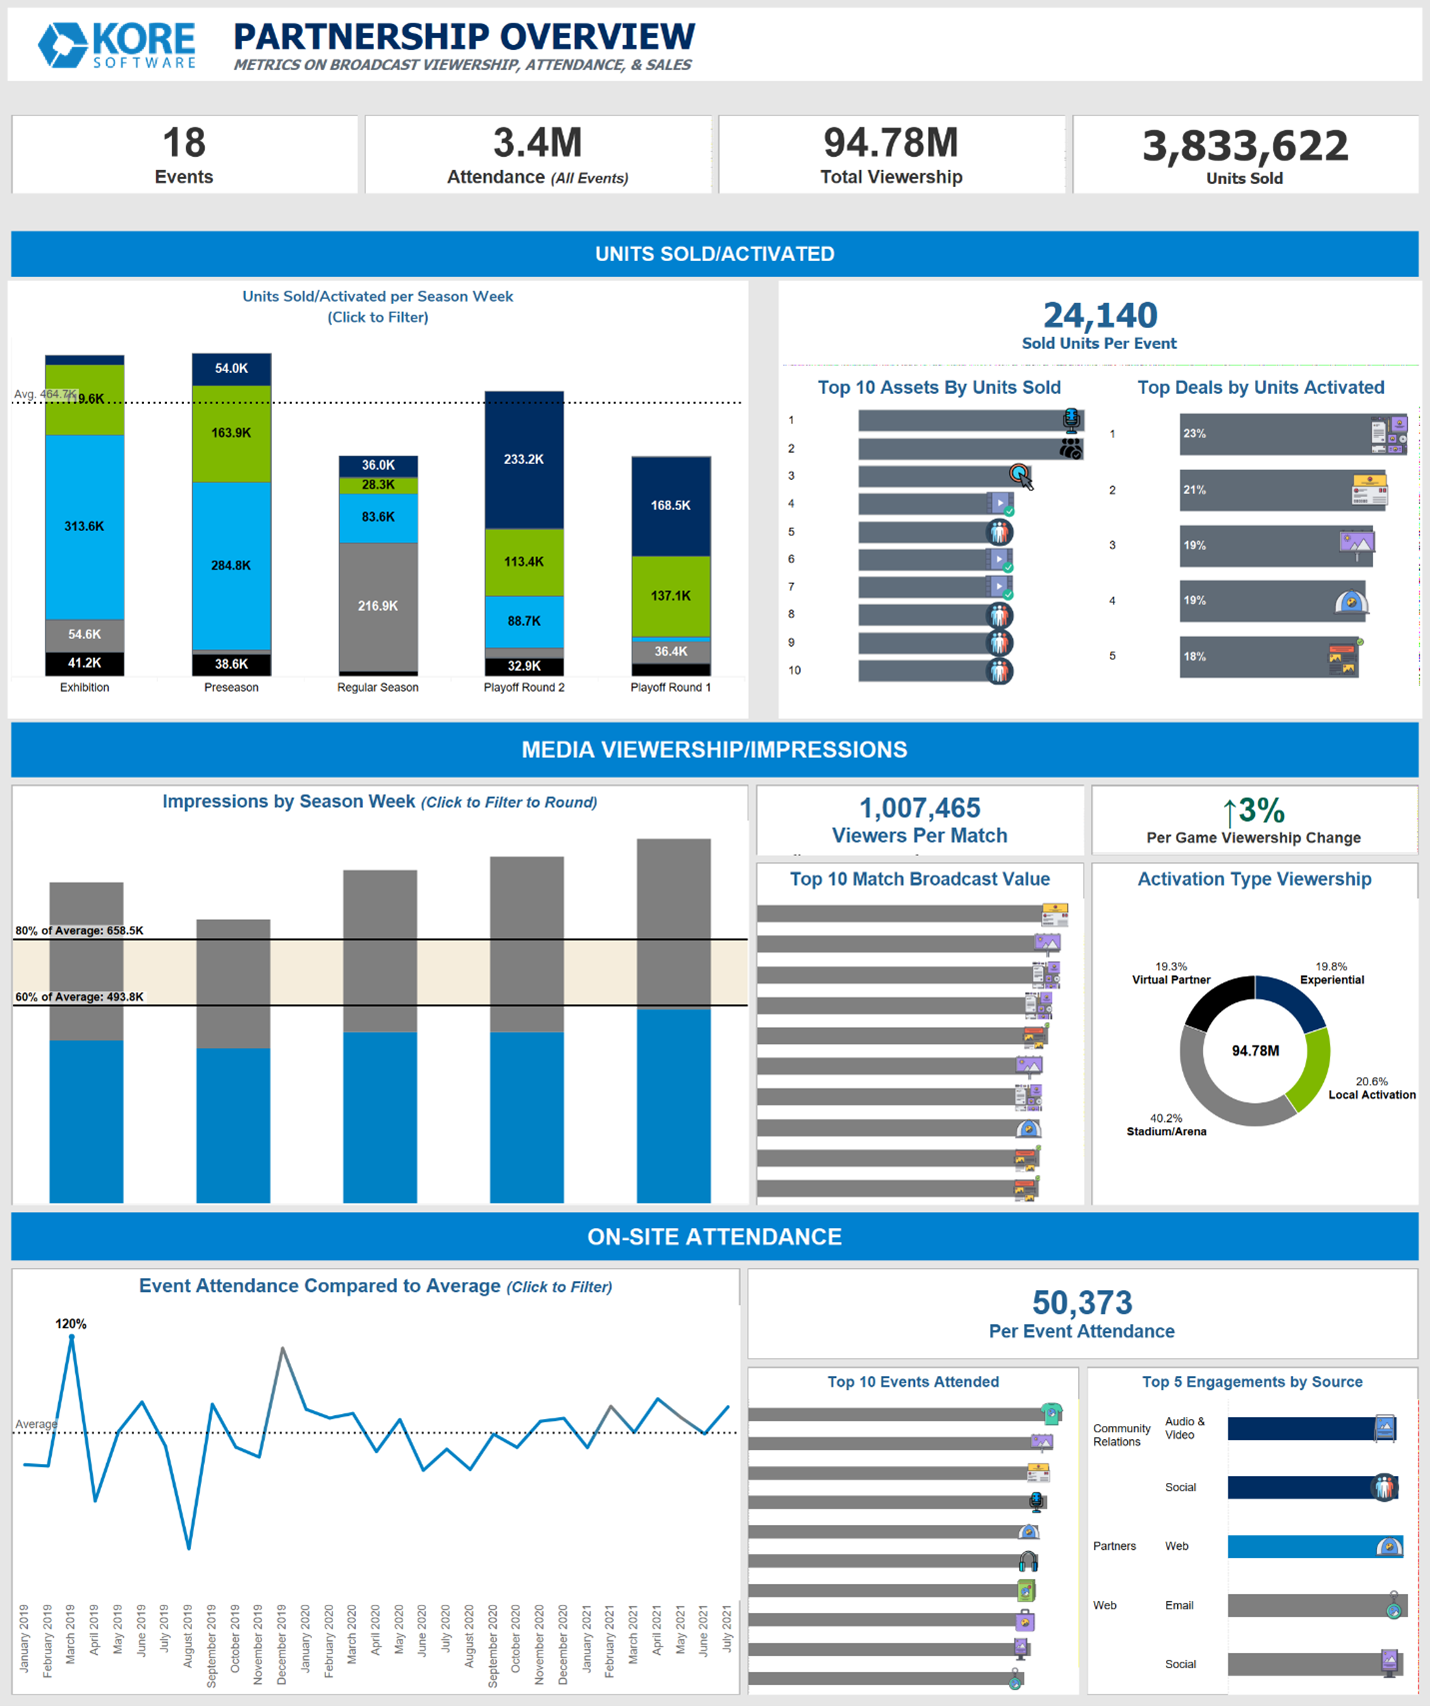
Another use case common with our customers is evaluating consumer value growth. For instance, if you have a partnership with a football team and this past November you did a military appreciation push with them, you may want to know how the event impacted in-venue sign ups of your services. Access to this type of insight allows for quick pivoting of what’s not working and continuing what is.
The Data Submission Portal in Evaluate ensures transparency between data providers and partners, which is key to making informed investment decisions. It also leads to timely reporting and true collaboration. Best of all, transparency fosters more successful partnerships because both sides have proof that they’re getting value from the relationship.
Consumer Value Growth Dashboard Showing Impact of Partnership on In-Venue Sign Ups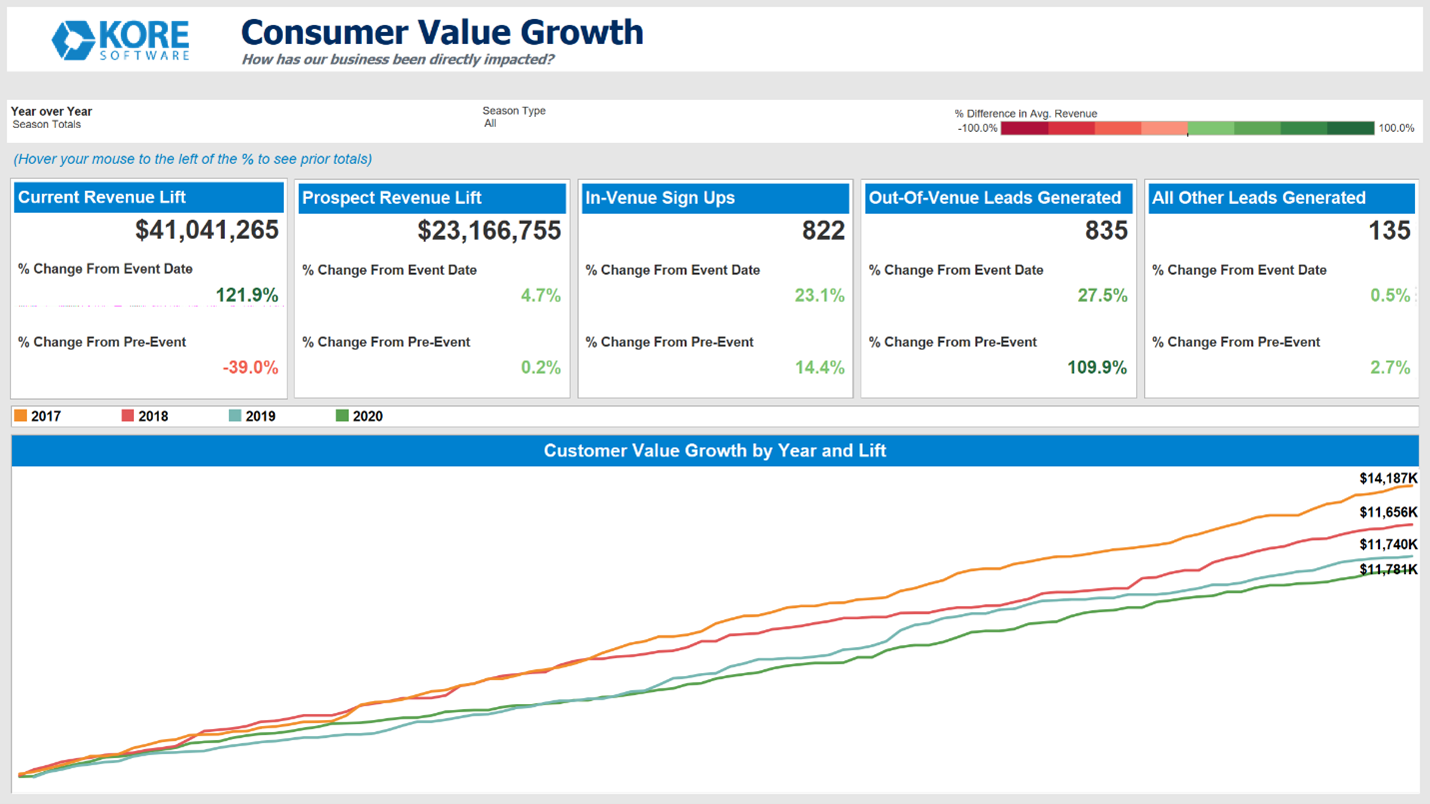
Interested in learning more about the Partnership Portal and how Evaluate can show you your whole partnership story? Request a 30-min demo here.

KORE is the global leader in engagement marketing solutions, serving more than 200 professional teams and 850+ sports and entertainment properties worldwide, providing practical tools and services to harness customer data, facilitate sponsorship sales and activation, and create actionable insights.
