

Enter the third week of March, best known for trading an hour of sleep for some extra daylight, St. Patrick’s Day, and—of course—college basketball. If you flipped through any sports channels over the past week, you likely saw a story reflecting on how the Men’s and Women’s NCAA® tournaments were cancelled almost exactly 12 months ago. Following the success of the other professional leagues using “bubbles” to close out COVID-shortened seasons.
To join in on the fun, KORE imagined what a tournament bracket of sponsorship assets might look like. Which opportunities are brands most likely to sign up for? What assets are rights holders selling most frequently?
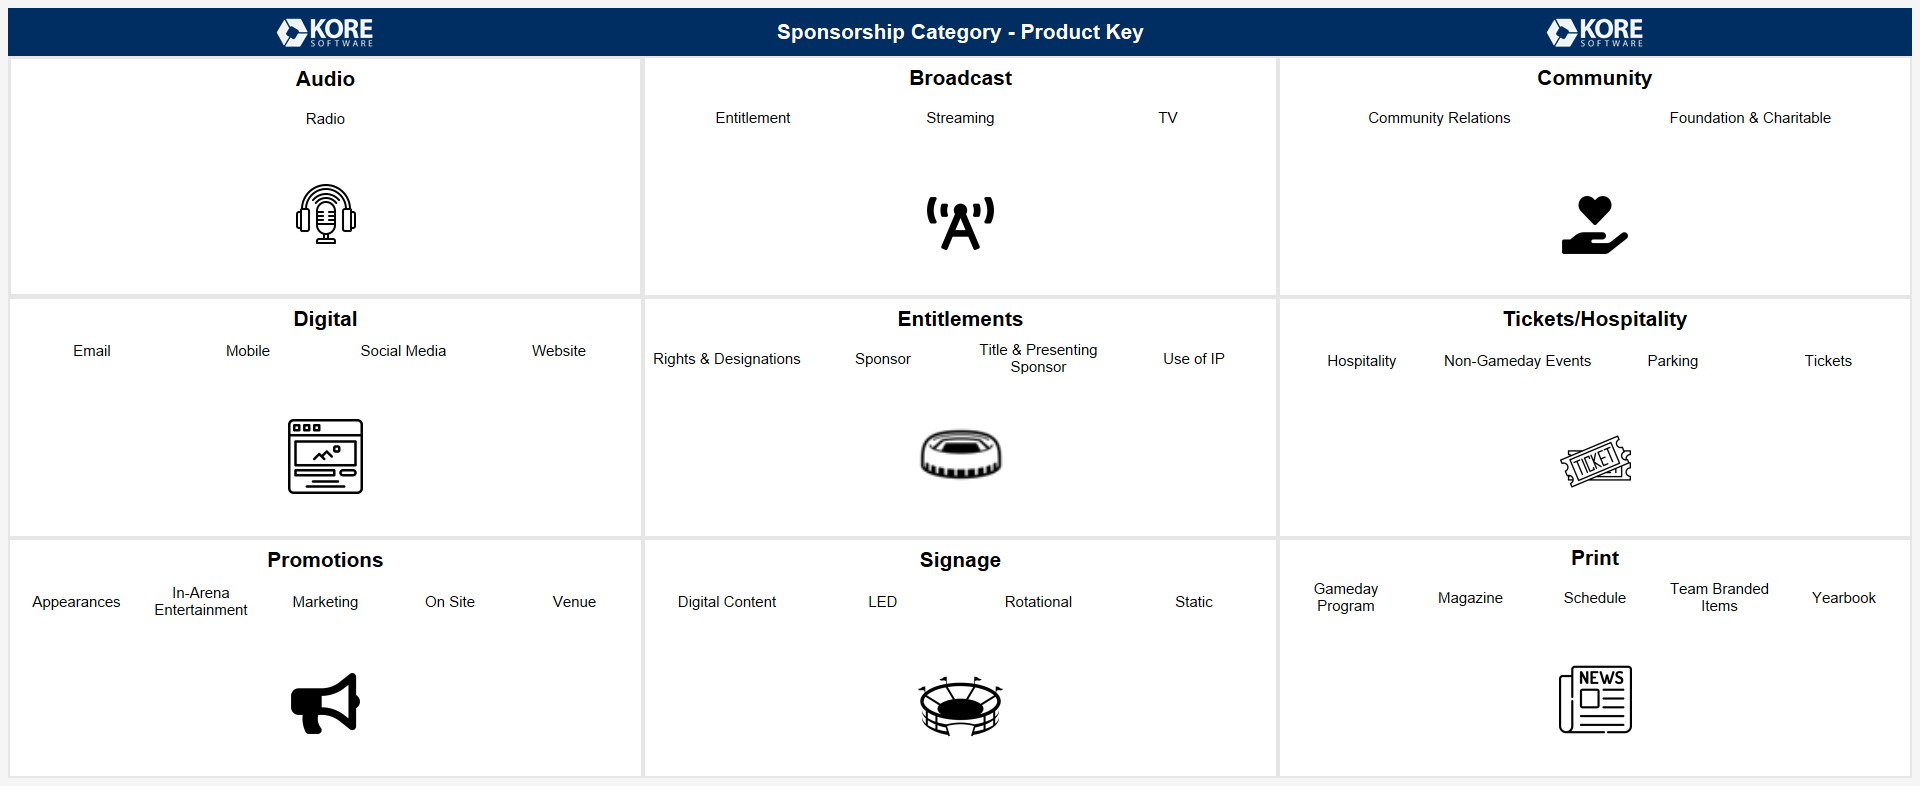
To begin, we selected the 32 sponsorship products included in the highest number of deals. This isn’t the same as the “most sold” products; some sponsorship assets are commonly sold in large quantities (such as digital signage) while others are much more limited (such as Presenting Sponsor rights). Our data shows that the average collegiate sponsorship deal (across all sports and genders) contains three single-quantity assets out of 11 total assets.
The table below shows sponsorship products, organized by which category they are mapped to.
Schools and conferences can have their own unique sponsorship deals separate from the NCAA® —especially in local markets. Our bracket summarizes deals at the school and conference levels.
After dividing up the assets into four “regions”, they competed head-to-head—those included in the most separate deals moved on to the next round. The four semi-finalists included most often in collegiate sponsorship deals, in order are: radio, website, LED, and tickets.
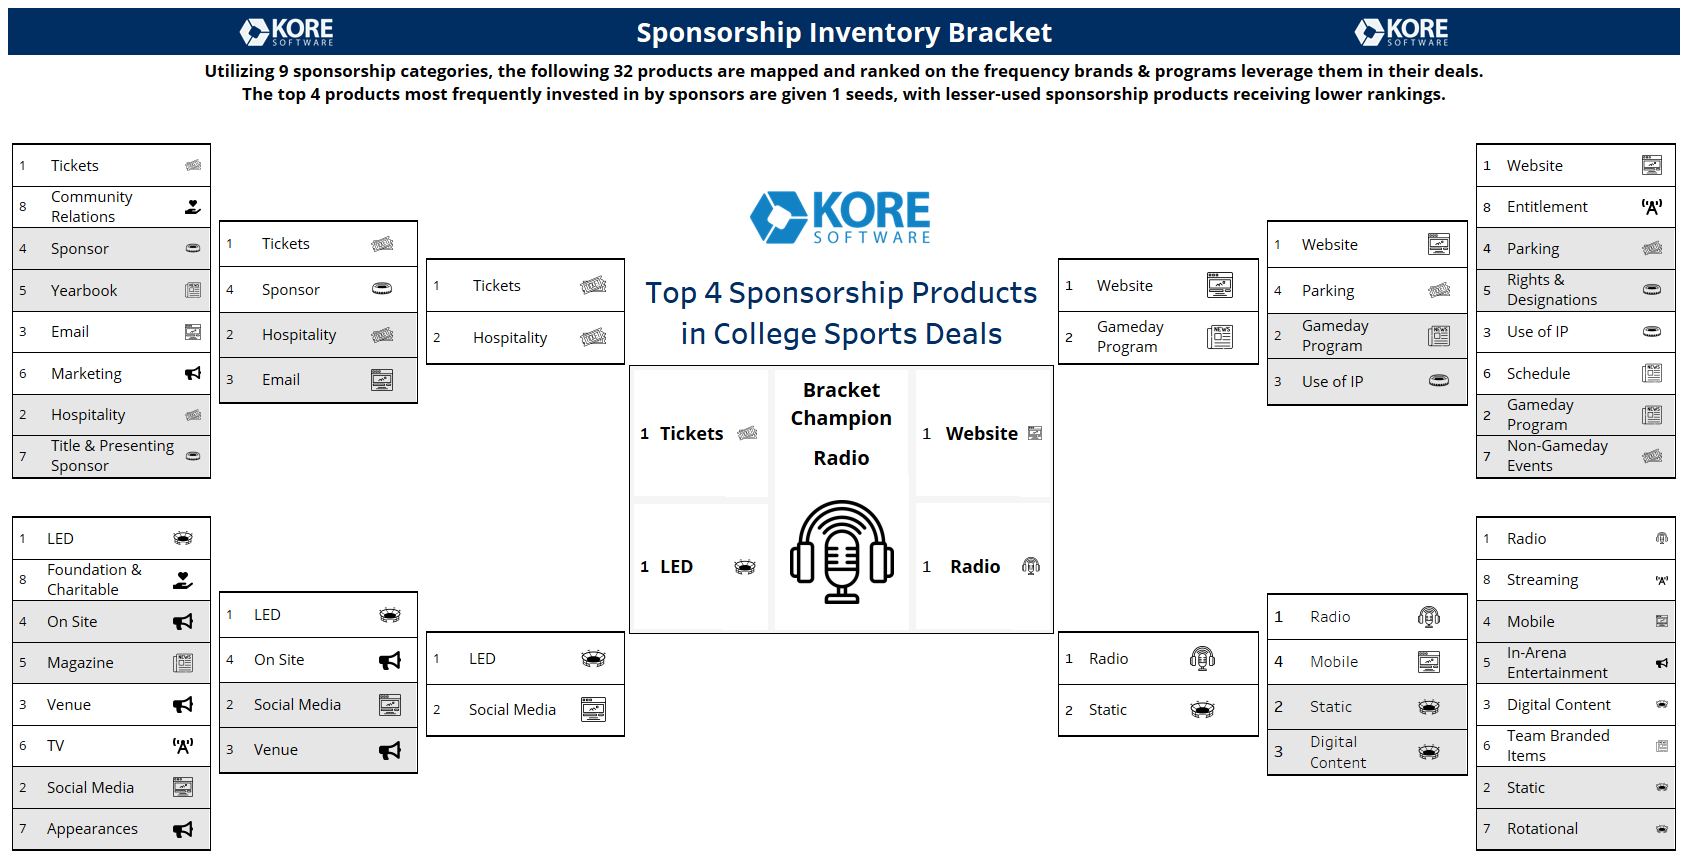
The first thing that sticks out is the large presence of radio products across the country. This asset is included in over 40% of deals last year and is very prominent because of its affordable cost—a result of the length of a typical sporting event and a frequent surplus of slots to fill. It can feel like a bit of a throwback to older times when compared to other top products, though there’s still value to be had.
LED signage emphasizes the importance of TV-friendly assets, while the inclusion of tickets reflects the value sponsors can find in entertaining their clients. Companies that associate their brands with sports often have fans who are enthusiastic to support their local teams, and can use these assets for prospecting and customer appreciation.
Shifting to website assets, Capital One has one of the most prominent ads on NCAA.com. And anyone who watches even a few minutes of a tournament game will likely see Capital One’s courtside LED signage and/or TV commercials. Seeing this brand extensively use two of the top four products demonstrates the value large organizations are putting on these assets.
One surprise is that streaming assets didn’t make it past the first round. Nielsen confirms that streaming viewership is on the rise and that subscription video on-demand (SVOD) programming reaches an audience that traditional TV typically would not. However, the NCAA® and CBS have such a massive broadcasting contract through 2032 that it’s clear streaming just isn’t a major asset yet. Even so, we may see more adoption of streaming during this year’s tournament which is available on Paramount+ (owned by ViacomCBS). But TV is still where it’s at—and with the excitement for this year’s tournament after last year’s was scrapped, TV ratings will likely match 2019’s impressive growth numbers.