

Cricket had one of its most engaged audiences ever. A quick comparison of 2022’s Cricket Twenty20 World Cup social data to the 2021 Olympics in Tokyo shows us that cricket fans watched 2.83B videos on the sport, versus 2.5B videos watched during the last Olympics. The social value created across both events was nearly identical ($67M during the games, versus $66.2M for cricket).
It wasn’t only legendary England who won the Cricket Twenty20 World Cup, but one could say that edtech brand, BYJU’S was victorious in terms of brand sponsorship value. The India-based app earned the most adjusted ad value (AAV) across social from the month-long activations of the year’s biggest cricket event. In this recap we will explain who created the most social sponsorship value, where it came from, how cricket compares to other sports, and tips on how the sport of cricket and its promoters can harness social content strategy.
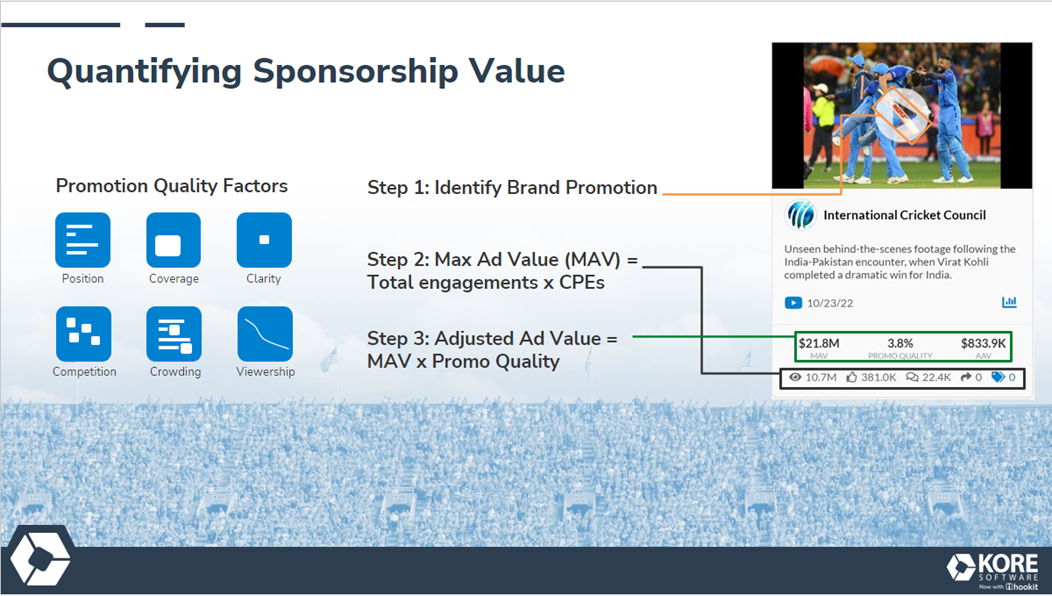
First, Why is Adjusted Ad Value (AAV) Important to Understand for Sponsorship Impact on Social?
The AAV model assigns a dollar value to a social post based on how clearly logos or brand mentions are displayed within text, image, or video and how much engagement the post generates.
Text-only social listening tools miss significant visual attribution. Evaluate Social can capture up to 70% of a brand’s social value through:
- Clear, quality logo visibility
- Audience data and watch-through rates
- Built-in authentication
These features create a robust data story. We can track the AAV of any content created on social media that displays clear logos, deliberate tags, and keyword mentions.
Our AI-driven Evaluate Social tool, powered by Hookit, (and found within the Portfolio Optimization Platform) enables any organization to easily track and analyze the AAV of their partners’ social media content. It’s a two-way street that helps drive stronger partnership value for brands, rights holders, athletes and influencers.
Visual Example of the AAV Model
The ‘Unseen behind-the-scenes’ footage post of India’s win over Pakistan on October 23, 2022 was the single most engaged post throughout our analysis.
What Was Analyzed
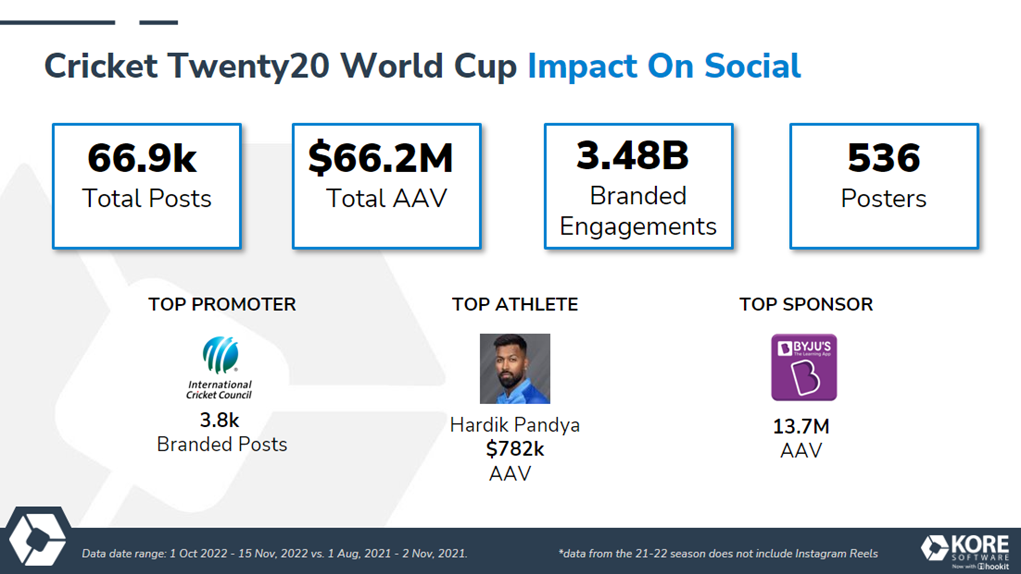
From October 1, through November 15, 2022, Evaluate Social examined 66.9k posts from athletes, organizations, leagues, team accounts (club and country), events and media accounts across the cricket world cup.
General Stats:
- Total Engagements: 4.8B
- Total Branded Posts: 22.8k (34% of all posts)
- Total Branded Engagements: 3.48B
- Promotion Quality: 16.1%
- AAV: $66.2M
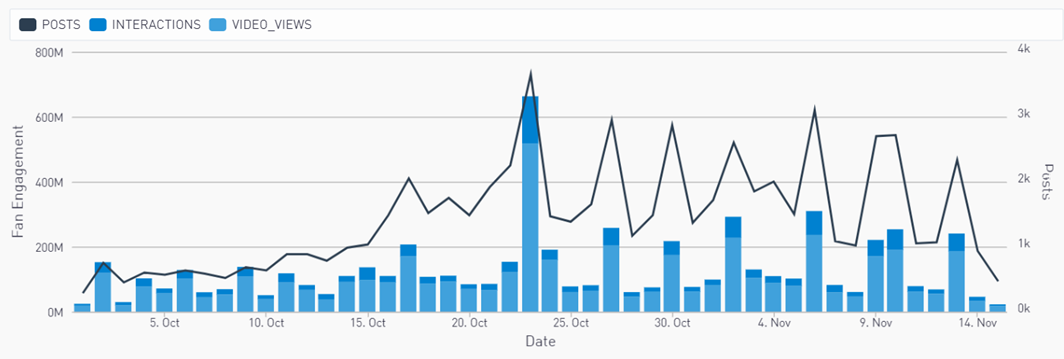
Fan Engagement Through Cricket Twenty20 World Cup
Notice the spike on October 23rd in the graph below, which is from the visual example above of the behind-the-scenes post by the International Cricket Council, with more than 600M engagements.
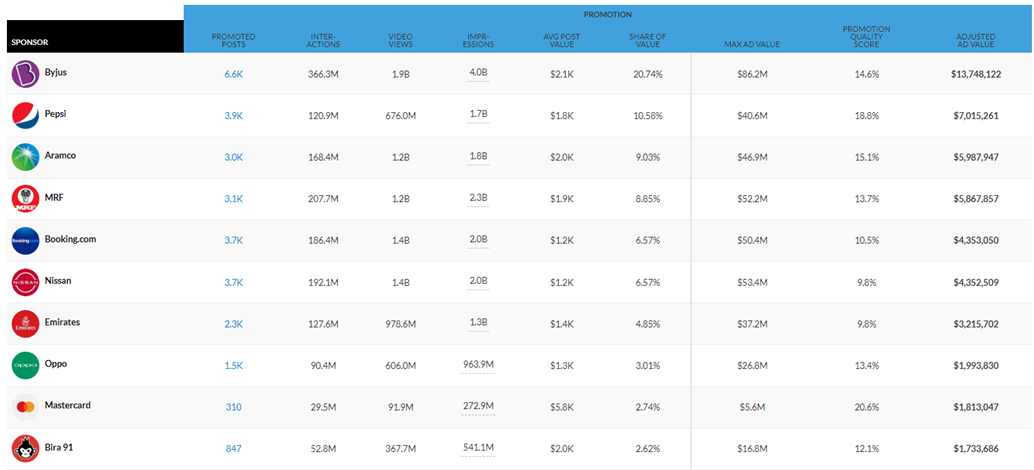
Top 10 Cricket Sponsors Based on AAV of Banded Posts
Any time the word “branded” is used (branded posts, branded engagement), we are referring to posts or content that includes either text (hashtag, mention, keyword) or visual (logo) promotion of a brand.
Below are the top brands that benefited from branded posts during the cricket world cup. Byjus gained the most value overall, by more than $6M, while 60% of the top 10 brands ranged between $1.99M – 6M.
- Byjus – $13.7M in AAV
- Pepsi – $7M in AAV
- Aramco – $5.99M in AAV
- MRF – $5.87M in AAV
- Booking.com – $4.35M in AAV
- Nissan – $4.35M in AAV
- Emirates – $3.2M in AAV
- Oppo – $1.99M in AAV
- Mastercard – $1.8M in AAV
- Bira 91- $1.73M in AAV
More noteworthy takeaways from the list above
- 21% of all value goes to Byjus
- 17% of the value comes from team accounts (club & country)
- 95% of the value is coming from each entity’s owned accounts (vs. earned from mentions from other entities)
- 76% of value is coming from Instagram, even though only 45% of branded posts are on Instagram
- Twitter contributes 27% of posts, but only 8% of total value and 3% of total engagements
Top Value Drivers from an Entity’s own Social Channels
This means these three organizations or teams created the most value from their own social post strategies.
- International Cricket Council – $31.2M in AAV, 47% of total value created
- Indian Cricket Team – $9.4M in AAV, 14% of total value created
- Pakistan Cricket Board — $6.5M in AAV, 10% of total value create
Top Cricket Athletes Based on AAV
These are the athletes that created the most value for sponsors.
- Hardik Pandya drove 26% of the total value created from all athletes with $409k in AAV for:
- Byjus — $131k
- FTX – $56k
- MRF – $42k
- Rohit Sharma drove 12% of the total value created from all athletes with $192k in AAV for:
- Emirates – $192k
- Mohamed Shami drove 11% of the total value created from all athletes with $175k in AAV for:
- Tourism West Australia — $102k
- Byjus — $33k
- FTX — $17k
Top Cricket Athletes based on Follower Growth
- Suryakumar Yadav – 3.8% follower growth during tournament
- Virat Kohli, 326M, 3% follower growth during tournament
- Rohit Sharma, 68M, 1.2% follower growth during tournament (for comparison, this is two times the amount of Lebron James’ current followers across social.)
Country Cricket Teams That Grew the Most Followers
- Indian Cricket Team – 55M, 1.1% follower growth during tournament
- South Africa Cricket — 6.6M, 0.27% follower growth during tournament
- Scotland cricket National Team — 231.5k, 2.3% follower growth during tournament
Club Cricket Teams That Grew the Most Followers
Club teams were much more active than country teams. The top three teams below had triple the growth over the country teams above.
- Barbados Royals, 3.4% increase during tournament
- Gujarat Titans, 3.2% increase during tournament
- Multan Sultans, 2.8% increase during tournament
- Average growth was 1.6%
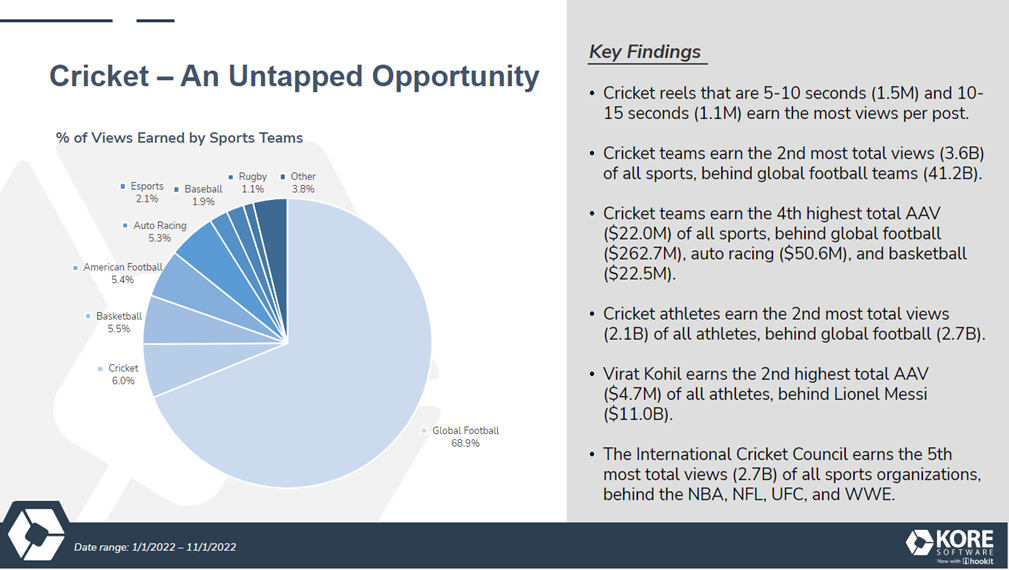
How Cricket Compares to Other Sports
Total fans, engagement, and sponsorship value (AAV)
- Cricket teams & leagues drive 6% of overall value in 2022 (1/1/22 – 11/15/22),
- Cricket teams & leagues drive 7% of overall fan engagements in 2022, 3rd highest sport behind Basketball and Global Football
- Cricket ranks 3rd in total followers (from team & league accounts) with 551.4M, only behind Basketball and Global Football
Discover More Opportunities
Earlier this year, we noticed a behavior shift in the popularity of short-form videos. Audience and creator preferences shifted from Instagram (IG) videos to reels. Further, the growth of IG Reels began to compete with TikTok, who was the leader of social video engagement. The data below (pulled from January 1, – November 1, 2022) demonstrates the investment opportunity that cricket offers, as the 5th largest driver of value across global sport.
Harness Content Strategy Across Your Partnerships
As audience preferences continue to shift towards short-form content, we don’t see the momentum of IG Reels slowing down in 2023. Social strategy is a critical part of investment strategy in the world of sports. If you’d like more key social insights like this, or tips on how to measure the value of your social activations then reach out for a demo on Evaluate Social, powered by Hookit.